Charts That Matter 2017
Featured
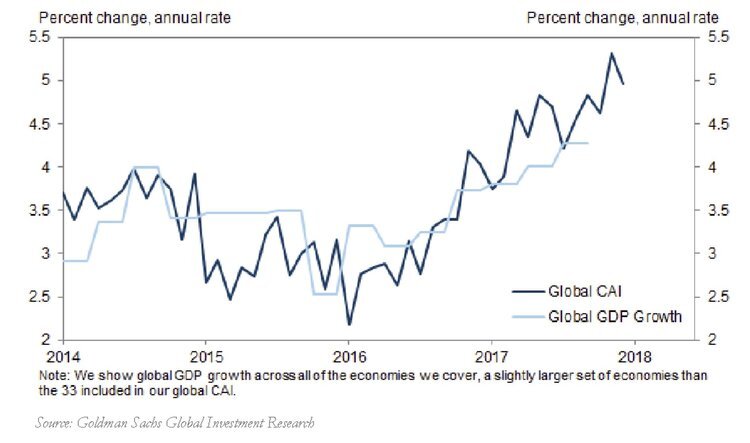


Global growth accelerated sharply in 2017 and the upswing became increasingly broad based throughout the year.
The Fed continued at a slow and steady pace with three rate hikes in 2017 while the ECB and BOJ stood pat.
Economic data are beating expectations by the most in nearly six years according to Citigroup’s economic surprise index. It’s massive run higher is one sign that the economy has gained momentum this year.
Broadly speaking, the economy remains in the goldilocks phase of the financial & business cycles.
Bitcoin’s meteoric rise in 2017 has been unprecedented; making other market moves that led to eventual bubbles look rather insignificant.
The U.S. economy expanded at a 3.3% rate in the third quarter of 2017; marking the second consecutive quarter of 3% GDP growth and the strongest quarter in 3 years.
Charting where the world’s largest economies fall in regards to economic, credit, and monetary policy cycles. A majority of countries continue to expand. However, higher volatility can be expected as we continue to progress into the later stages of the credit cycle and monetary policies become less accommodative.
How quickly things can change in just 10 years. Once dominated by the major corporate conglomerates, the five largest companies in the world measured by Market Capitalization are all tech companies. An illustration of how disruptive technology has become.
Synchronized global growth has been the dominating theme in 2017. Caterpillar’s dealer sales by region illustrate this theme as well – with global retail sales rising 13% year-over-year as reported in their third quarter earnings release
Economic cycles don’t die of old age. While the current economic cycle has been unusually long, when comparing the cycle with previous ones in terms of quantity – and not time – reveals an economy with plenty of time (and capacity) left for continued economic growth.
Hurricane Harvey & Irma trimmed US economic activity in September, primarily affecting manufacturing output. However, the nation’s economy showed encouraging resilience in a month of disruption as the flash estimate for the broader Manufacturing Index came in at 54.6; comfortably above the 50 point threshold that indicates expansion.
Strong Consumer Confidence, improving labor markets, and low interest rates are all contributing to the domestic demand forces driving the Eurozone’s recovery.
The end of an era for unprecedented monetary policy. The Federal Reserve announced on 9/20/2017 that it will start to unwind the easy money policy that it has pursued since the Global Financial Crisis and will begin to allow $10BN of bonds mature every month starting in October.
The output gap – which measures potential GDP, realized GDP, and estimated natural rate of employment – has narrowed; reflecting realized growth that is essentially in line with potential growth. Reaching a low of -6% in 2009, the level of “slack” in the economy has almost been worked-off.
Improving home values and rising equity markets propelled the total net worth of U.S. households further into record territory during the second quarter of 2017.